Writing a Linux driver for the Apple RAID Card
In this post, I describe from start to finish how I reverse-engineered the communication between the Apple RAID Card and its macOS driver to write a basic Linux driver for it. To do this, I modified the QEMU hypervisor to facilitate tracing DMA traffic between macOS and the device, wrote an emulated “digital twin” of the RAID Card as a QEMU device to validate and refine my understanding of the communication protocol, and finally wrote a “hackathon-quality” Linux driver for the emulated device and successfully tested it against the real hardware.
This was a long adventure full of twists and turns, many of which I won’t describe here. My main goal was not to engineer a perfect Linux driver and contribute it upstream, to understand everything about the RAID Card, or to make choices at every juncture that were the optimal use of time or the best way to solve a problem. This was a personal project, so my goal was instead to maximize my learning and maximize the fun I had. Many of the choices and approaches I’ll describe here make no sense from the standpoint of doing this the “right” way, but they did contribute to maximizing my learning and fun.
This post is not intended to fully explain all the technical concepts involved in this project, or even go into many details about the various pieces of the project. Other sources explain them better than I can in passing, and explaining the concepts and details here would take up too much space and distract from the interesting and novel parts of this project. I will try to link other resources in places where I assume certain knowledge.
Table of contents
- Background
- Initial investigation
- Digging deeper into the traces
- Tracing DMA traffic
- Understanding the SCSI commands
- Building a “digital twin”
- Writing a Linux driver
- Conclusion
Background
In May 2023, I bought a 2009 Xserve from an online government surplus auction for about $120. It’s a nice configuration, with dual 2.66 GHz quad-core Xeon processors for 8 cores total (Gainestown/Nehalem), dual redundant power supplies, and 24GB of RAM. It came populated with 3 Apple Drive Modules, Apple’s proprietary hard drive carriers.
Upon booting the Xserve for the first time and installing Mac OS X Server 10.5 Leopard, I was greeted with an error message about the backup battery for the RAID card, confirming that this Xserve had the optional SAS/SATA RAID card and not the regular drive backplane without the integrated RAID controller. The Xserve is quite loud–I measured it around 64 dB at about 12” and its fans can be heard from several rooms away–and I don’t have any place to run it where I won’t be annoyed by the noise, so I have little practical use for it.
The Xserve sat unused for a few months until I was working on an unrelated project one weekend. For part of the project, I needed a machine with a decent amount of RAM, so I figured I would install Linux on the Xserve. I started the installation but quickly ran into an issue: the disks were not visible to the installer. After a few minutes of research, I learned that there is no Linux driver for the RAID backplane, meaning the disks are entirely unusable under Linux. I was able to hack up an installation, using a USB flash drive as the boot disk and running my project from a tmpfs (since cheap USB flash drives have abysmal performance when used as an OS disk, something that became immediately apparent…), but this experience left a nagging question in my head:
Why wasn’t there a Linux driver for this? Linux generally has great hardware support, especially for desktops and servers. Was this RAID controller truly proprietary to Apple, not sharing anything with an existing device for which there was already a driver? Had nobody investigated it in enough depth to write a driver since this thing came out in the mid-2000s, more than 15 years ago? The 2006 and 2008 Xserves also had optional RAID controllers, which as far as I can tell are based on the same basic chip and setup.
And this question naturally sparked another:
How hard could it be to write a driver for this device myself?
Initial investigation
When someone asks “how hard could it be?” about computing topics, there’s a decent chance they don’t know what they’re talking about and the answer is frequently “rather difficult”. In this case, both of those things turned out to be true: I had very little idea what I was getting myself into, and it turned out to be a lot. While I have a computer science degree and greatly enjoyed my computer architecture and operating systems classes, I/O was barely covered in the classes I took and device drivers weren’t covered at all. Beyond that, I had absolutely no knowledge about PCI(e) or hard drives/RAID controllers and the communication standards they use. I don’t do any of this sort of thing for my day job (I’m currently an iOS developer). In other words, I would need to learn a lot to make this project work.
Before we continue, there are a few things you should know about me:
- I am very curious about a wide variety of topics with special interest in topics proximate to this project, including operating systems, hardware from a high level, reverse engineering, and Apple products. I enjoy learning new things purely for the sake of learning them, and I don’t much care if the practical value is limited.
- It doesn’t take a lot beyond an interesting problem to motivate me for a personal project.
- I have a lot of free time on my hands.
These three turned out to be a dangerous combination that led me to spend hundreds of hours on this project over the past year and a half, maybe even more than a thousand hours.
I started with an investigation into this device and found remarkably little about it on the internet aside from one MacRumors forum thread with little concrete information. I obtained a firmware image (unfortunately Apple seems to have removed the download link since I did) and analyzed it in detail to see if the MacRumors post was correct.
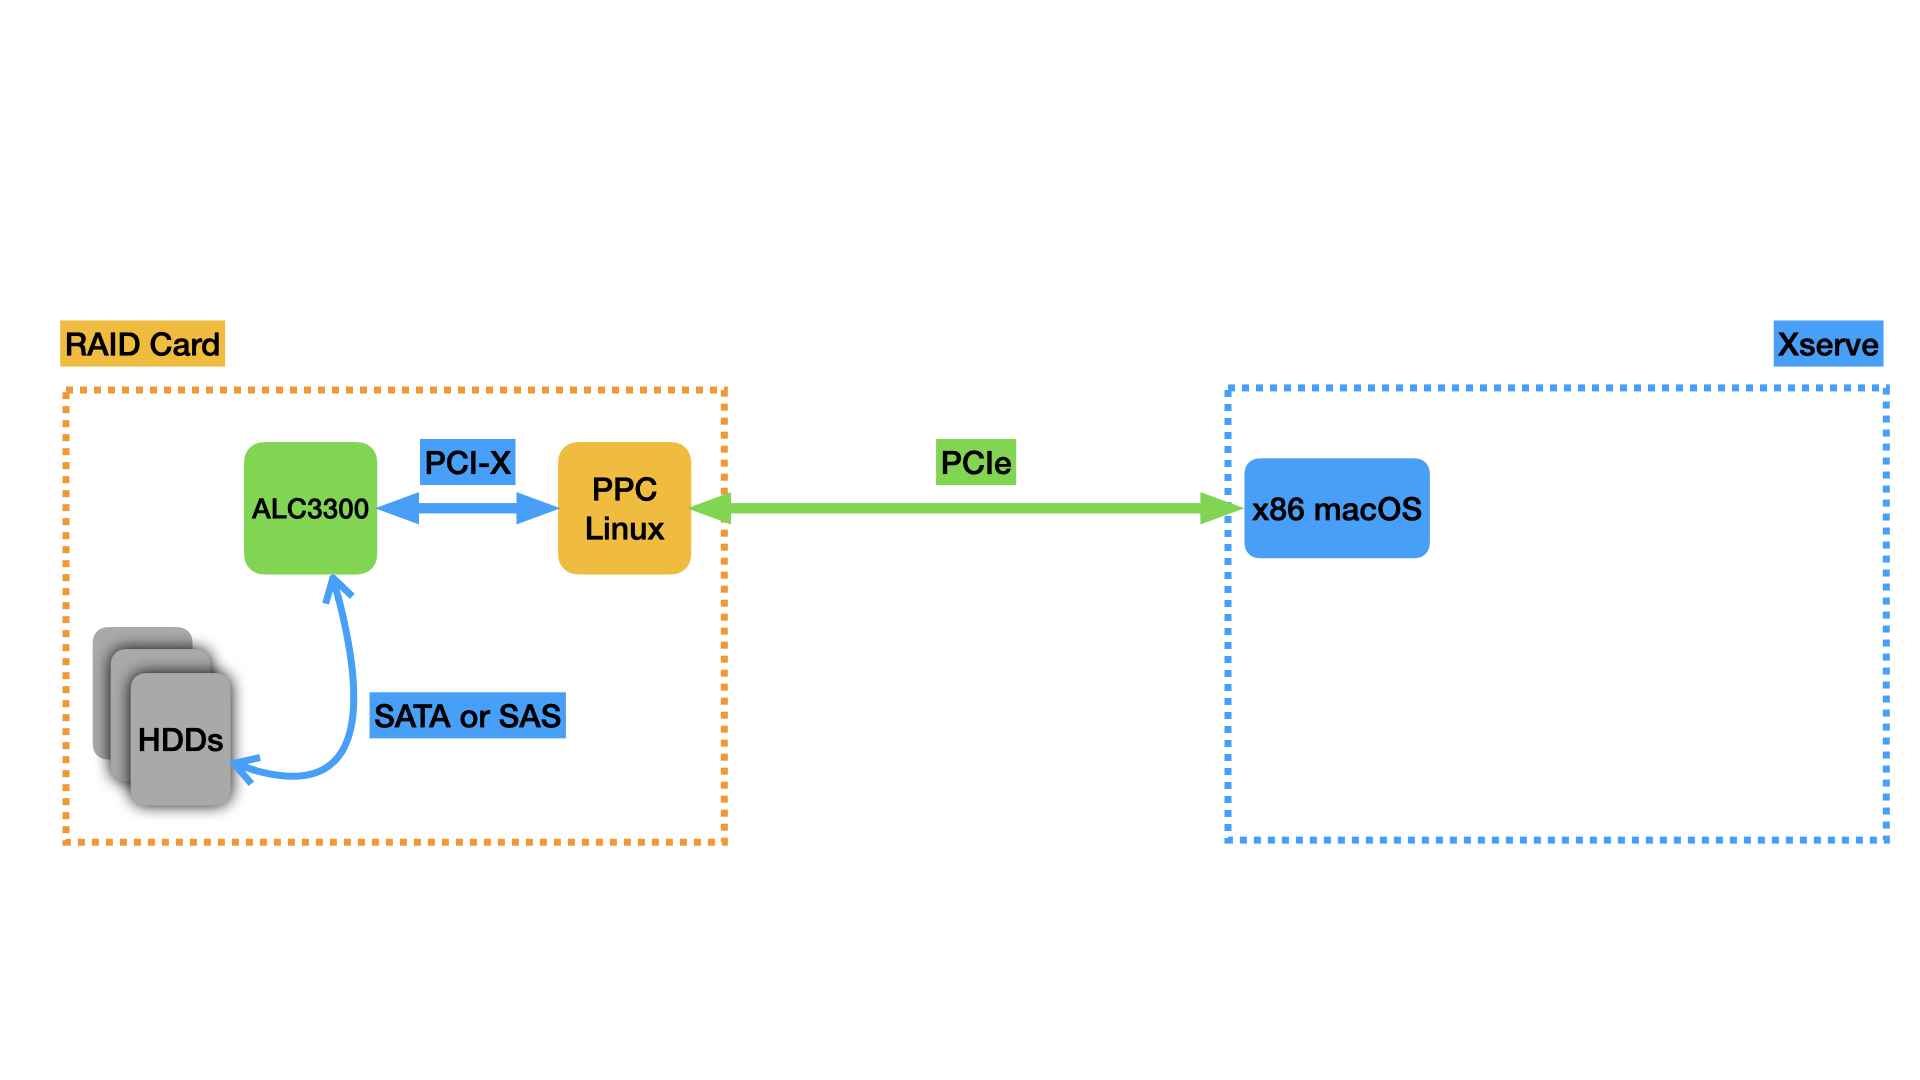
The broad strokes of the post turn out to be correct–the card does have an embedded Linux system running on a PowerPC chip, the RAID functionality is powered by silicon from Aristos Logic, and there are two components to the firmware, one more generic and one customized to the Apple application. It’s true that the RAID volumes are exported as emulated SCSI volumes/logical units to the host system. However, as we will come to find out, it does not use a TCP tunnel over the PCIe connection, and there’s no Apache webserver for a SOAP configuration interface. There is a SOAP configuration interface, but it’s part of the generic component of the firmware and the server is integrated into the C++ application (tsal), which the Apple-specific component (pshim, short for “proxy/shim”) communicates with over HTTP (local to the embedded Linux system) in addition to a shared memory region between the two processes. “Apache” (abbreviated apci in the firmware) seems to be the codename used for the custom host (macOS) <–> device communication protocol specific to the Apple cards, which we reverse-engineer in this post. There is also a firmware component for talking to the cache battery over I2C that communicates back to tsal using SysV IPC.
Here’s a diagram of the system from a high level. We will build on this diagram over the course of this post as I cover the tools I made to learn more about the device.
Analysis and binary reverse-engineering of the card’s firmware did not prove to be a productive way for me to understand the communication with the macOS host in enough detail to reproduce it in a Linux driver, so I turned to an alternate approach.
Using a virtual machine to learn more
My initial inspiration for the project, and the major reason I thought it might be feasible, was the work of the Asahi Linux team, bringing Linux and a bunch of device drivers to Macs with Apple Silicon chips. They’re using a black-box reverse engineering approach with a custom-built thin hypervisor to virtualize macOS and trace all its hardware accesses. From this, they’re able to understand how the hardware works and write Linux drivers for it. Similar black-box reverse engineering work was done by the nouveau project to build a FOSS Linux driver for Nvidia GPUs, though they did MMIO tracing at the operating system level to capture accesses made by the running closed-source Linux driver. That approach would need significant adaptation to work here because there is no Linux driver to trace, so I’d have to modify the macOS kernel, a task for which there’s significantly less documentation available. I wanted to take a virtualization-based approach like Asahi, but I don’t have the expertise to write my own hypervisor, so I decided to use QEMU as a jumping-off point and modify it as needed.
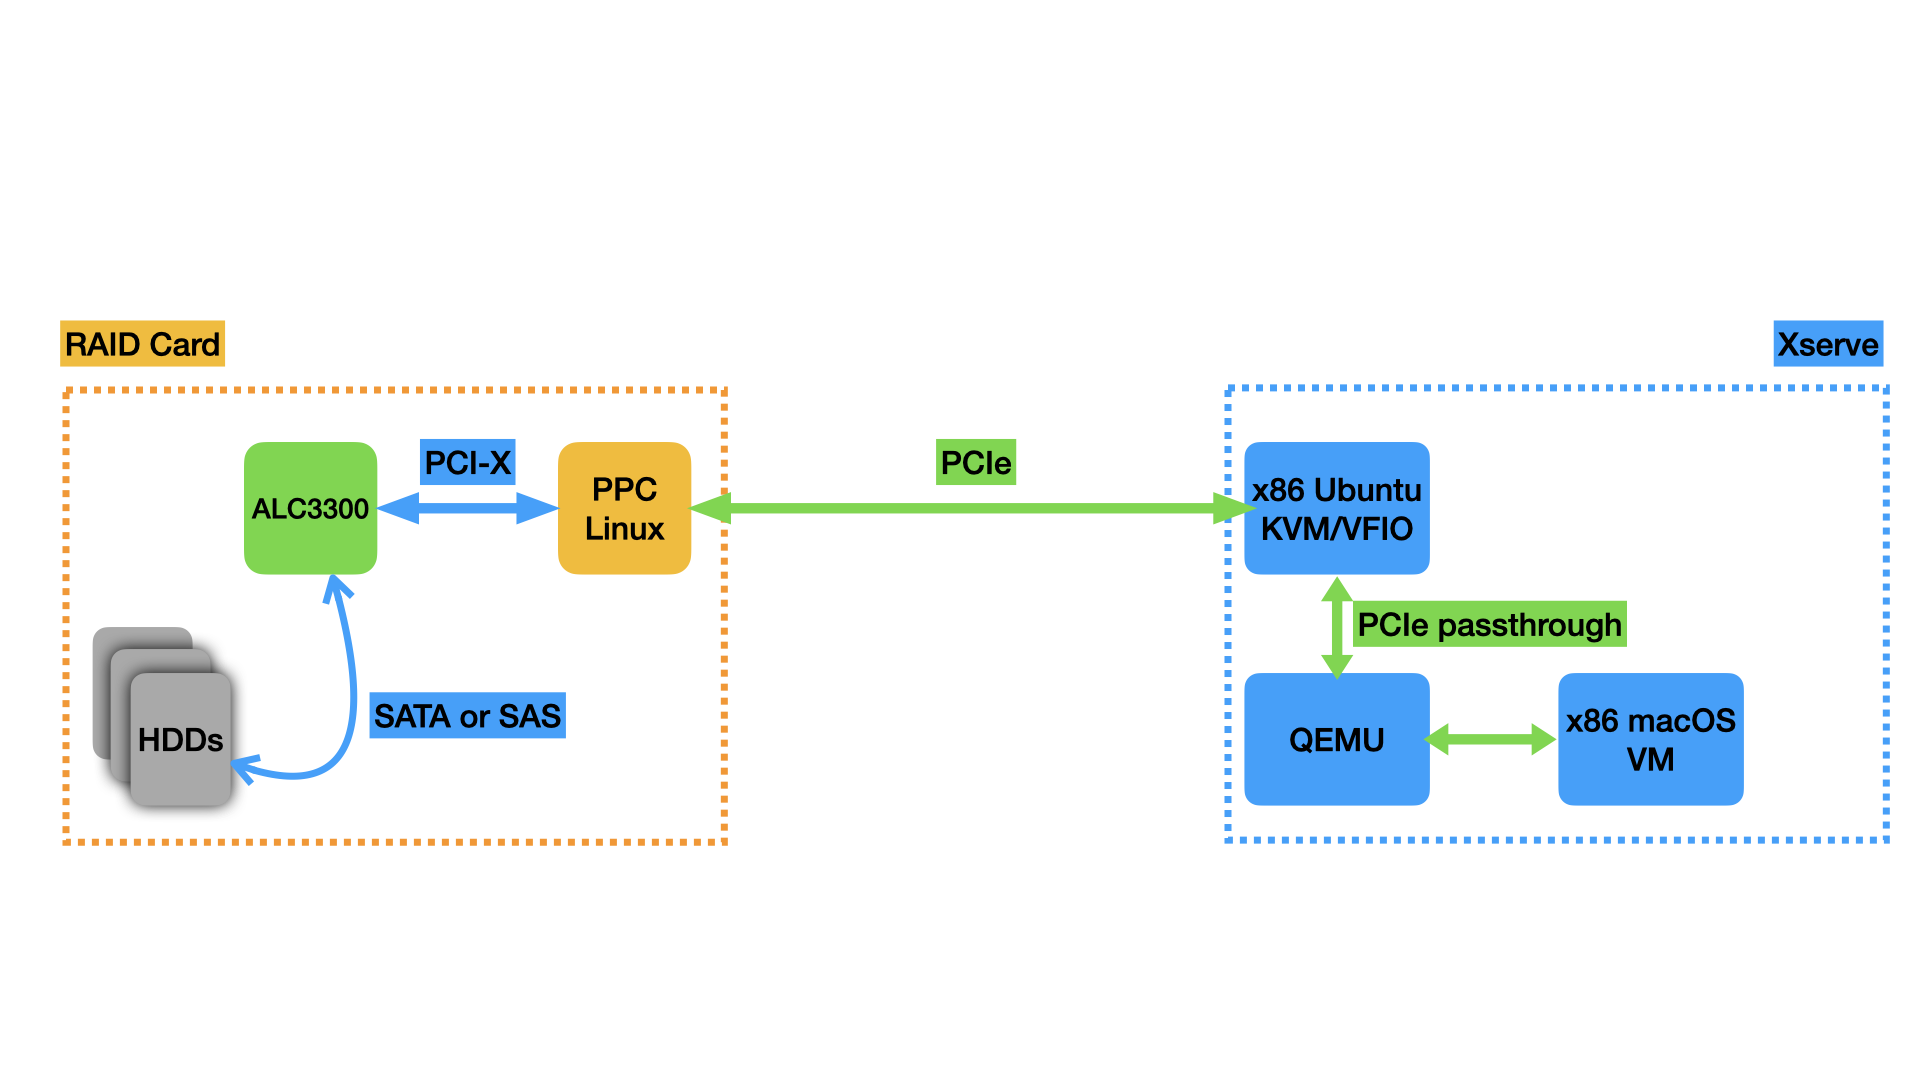
It was straightforward enough to install macOS in a QEMU VM running on the Xserve under Linux (still booting from a USB flash drive and using a tmpfs for the files). It was also relatively easy to set up PCIe passthrough with Linux’s VFIO subsystem and assign the RAID card PCIe device to the virtual machine. With my passthrough setup, macOS recognized the RAID card and I was able to interact with it just as if I was running macOS on the bare metal, a promising start. I am fortunate that the 2009 Xserve was the first Xserve to include an IOMMU (Intel VT-d), which is required to pass PCIe devices through to VMs. Without the IOMMU, this approach to the project would not have been possible.
Here’s what the setup for the passthrough looks like, expanding the diagram from above:
QEMU has robust built-in tracing facilities, enabling the user to trace a number of events. The QEMU VFIO integration is no exception, enabling the tracing of memory-mapped I/O (MMIO) accesses that the guest OS makes to the VFIO-passed-through hardware, interrupts the hardware sends back to the guest OS, and more. The tracing happens when the guest OS makes an MMIO access, triggering QEMU to emulate that access. QEMU passes the access along to the VFIO kernel driver, which passes it along to the hardware. A similar process happens in reverse for interrupts coming from the device.
There’s a slight wrinkle here: all this switching between the guest OS and QEMU running in the host OS userspace can incur performance penalties. To mitigate these, the Linux KVM hypervisor can work with VFIO to handle device accesses entirely inside the kernel, without the QEMU code in userspace needing to run at all. This excellent talk from KVM Forum 2016 was instrumental to figuring this out. The fast paths are enabled by default, so I wasn’t seeing any VFIO trace events the first few times I tried. For this application, these fast paths are bad–we want QEMU to run every time the guest OS makes a hardware access so that the trace events fire. Thankfully, QEMU has knobs to disable all these fast paths and force all interaction with VFIO to happen in userspace where we can trace it. The QEMU invocation looks (in relevant part) like this:
qemu-system-x86_64
-enable-kvm
...
-device vfio-pci,host=01:00.0,x-no-mmap=true,x-no-kvm-intx=true,x-no-kvm-msi=true,x-no-kvm-msix=true,x-no-kvm-ioeventfd=true,x-no-vfio-ioeventfd=true
-trace events=/home/nathan/82_vfio_events.txt
You can see we’re disabling all of the fast-path optimizations that could cause QEMU to miss events that we want to trace and we’re providing a path to a file with all the VFIO event names to trace.
With the tracing squared away, I was able to boot macOS and get trace output like this, showing macOS performing MMIO accesses to the RAID card:
vfio_region_read 22.727 pid=1864 name=b'0000:01:00.0' index=0x0 addr=0xb4 size=0x4 data=0x80000000
vfio_region_read 12.116 pid=1864 name=b'0000:01:00.0' index=0x0 addr=0xbc size=0x4 data=0x81000000
vfio_region_write 21.652 pid=1864 name=b'0000:01:00.0' index=0x0 addr=0x5d data=0x0 size=0x1
vfio_region_write 19.799 pid=1864 name=b'0000:01:00.0' index=0x0 addr=0xe4 data=0x80000000 size=0x4
vfio_region_write 11.126 pid=1864 name=b'0000:01:00.0' index=0x0 addr=0xe8 data=0x1000000 size=0x4
vfio_region_write 11.734 pid=1864 name=b'0000:01:00.0' index=0x0 addr=0xec data=0x81000000 size=0x4
vfio_region_write 17.613 pid=1864 name=b'0000:01:00.0' index=0x0 addr=0xf4 data=0x0 size=0x4
vfio_region_write 29506.242 pid=1864 name=b'0000:01:00.0' index=0x0 addr=0xf8 data=0x50b70a size=0x4
vfio_region_write 6225.254 pid=1864 name=b'0000:01:00.0' index=0x0 addr=0xfc data=0x0 size=0x4
vfio_region_write 11258.777 pid=1864 name=b'0000:01:00.0' index=0x0 addr=0x100 data=0x70b70a size=0x4
vfio_region_write 741.948 pid=1864 name=b'0000:01:00.0' index=0x0 addr=0x104 data=0x100000 size=0x4
vfio_region_write 13.936 pid=1864 name=b'0000:01:00.0' index=0x0 addr=0x114 data=0x0 size=0x4
vfio_region_write 10247.915 pid=1864 name=b'0000:01:00.0' index=0x0 addr=0x118 data=0x60b70a size=0x4
vfio_region_write 311.651 pid=1864 name=b'0000:01:00.0' index=0x0 addr=0x11c data=0x0 size=0x4
vfio_region_write 6975.584 pid=1864 name=b'0000:01:00.0' index=0x0 addr=0x120 data=0x80b70a size=0x4
vfio_region_write 29.672 pid=1864 name=b'0000:01:00.0' index=0x0 addr=0x12c data=0x0 size=0x4
vfio_region_write 5005.633 pid=1864 name=b'0000:01:00.0' index=0x0 addr=0x130 data=0x90b70a size=0x4
vfio_region_write 263.347 pid=1864 name=b'0000:01:00.0' index=0x0 addr=0x134 data=0xac080000 size=0x4
vfio_region_write 30.406 pid=1864 name=b'0000:01:00.0' index=0x0 addr=0x144 data=0x0 size=0x4
vfio_region_write 7718.825 pid=1864 name=b'0000:01:00.0' index=0x0 addr=0x148 data=0xc0b90a size=0x4
vfio_region_read 44.931 pid=1864 name=b'0000:01:00.0' index=0x0 addr=0xc4 size=0x4 data=0x0
vfio_region_read 5.677 pid=1864 name=b'0000:01:00.0' index=0x0 addr=0xc8 size=0x4 data=0x74010000
vfio_region_read 1474.045 pid=1864 name=b'0000:01:00.0' index=0x0 addr=0x2c size=0x4 data=0x0
vfio_region_write 44.174 pid=1864 name=b'0000:01:00.0' index=0x0 addr=0x2c data=0x1000000 size=0x4
vfio_region_read 29.280 pid=1864 name=b'0000:01:00.0' index=0x0 addr=0x5d size=0x1 data=0x0
vfio_region_read 1000379.967 pid=1864 name=b'0000:01:00.0' index=0x0 addr=0x5d size=0x1 data=0x1
vfio_region_write 32.533 pid=1864 name=b'0000:01:00.0' index=0x0 addr=0x62 data=0x0 size=0x1
vfio_region_write 24.037 pid=1864 name=b'0000:01:00.0' index=0x0 addr=0x64 data=0x0 size=0x1
vfio_pci_read_config 41.888 pid=1864 name=b'0000:01:00.0' addr=0x22c len=0x4 val=0x4
vfio_region_write 50.290 pid=1864 name=b'0000:01:00.0' index=0x0 addr=0x61 data=0x0 size=0x1
vfio_region_read 291.585 pid=1864 name=b'0000:01:00.0' index=0x0 addr=0x68 size=0x4 data=0xa0040000
vfio_region_write 13003.574 pid=1864 name=b'0000:01:00.0' index=0x0 addr=0x68 data=0xa1040000 size=0x4
vfio_msi_interrupt 1933.592 pid=1864 name=b'0000:01:00.0' index=0x0 addr=0xfee00000 data=0x4073
vfio_region_read 13158.072 pid=1864 name=b'0000:01:00.0' index=0x0 addr=0x58 size=0x8 data=0x100010000010000
vfio_region_write 29.157 pid=1864 name=b'0000:01:00.0' index=0x0 addr=0x5a data=0x0 size=0x1
vfio_region_read 143.732 pid=1864 name=b'0000:01:00.0' index=0x0 addr=0x58 size=0x8 data=0x100010000000000
vfio_region_read 211.430 pid=1864 name=b'0000:01:00.0' index=0x0 addr=0x68 size=0x4 data=0xa1040000
vfio_region_write 11840.211 pid=1864 name=b'0000:01:00.0' index=0x0 addr=0x68 data=0xa2040000 size=0x4
vfio_msi_interrupt 62504.461 pid=1864 name=b'0000:01:00.0' index=0x0 addr=0xfee00000 data=0x4073
vfio_region_read 12832.344 pid=1864 name=b'0000:01:00.0' index=0x0 addr=0x58 size=0x8 data=0x100010000010000
vfio_region_write 27.672 pid=1864 name=b'0000:01:00.0' index=0x0 addr=0x5a data=0x0 size=0x1
vfio_region_read 140.560 pid=1224 name=b'0000:01:00.0' index=0x0 addr=0x58 size=0x8 data=0x100010000000000
... (a few near-repetitions of the preceding 5 lines) ...
vfio_region_read 1358.475 pid=1224 name=b'0000:01:00.0' index=0x0 addr=0x40 size=0x4 data=0x0
vfio_region_write 44.380 pid=1224 name=b'0000:01:00.0' index=0x0 addr=0x174 data=0x3b00 size=0x2
vfio_region_write 531572.429 pid=1224 name=b'0000:01:00.0' index=0x0 addr=0x40 data=0x1000000 size=0x4
vfio_msi_interrupt 698.223 pid=1224 name=b'0000:01:00.0' index=0x0 addr=0xfee00000 data=0x4073
vfio_region_read 527691.145 pid=1224 name=b'0000:01:00.0' index=0x0 addr=0x58 size=0x8 data=0x01 00 01 00 00 00 01 00
vfio_region_write 58.127 pid=1224 name=b'0000:01:00.0' index=0x0 addr=0x59 data=0x0 size=0x1
Digging deeper into the traces
At this point, I was getting pretty annoyed with booting my Xserve from the USB flash drive and copying important files to the tmpfs every time so I could run stuff with acceptable performance. Booting took more than 5 minutes. To improve the situation, I bought a cheap SATA card and an SSD to boot Linux from, at this point completely negating the last shred of practical benefit this project could possibly have. This brought the boot time down to 1 minute. Now I was able to start collecting more traces and analyzing them in detail.
The first insight that’s almost immediately obvious from the trace excerpted above is that this can’t possibly be all the communication between macOS and the card. The cycle of writing specific values to a small set of registers, interrupts, and reading specific values back from another small set of registers continued, with some values being incremented but otherwise not much change. This is clearly not enough variation to capture the variety of commands and responses we’d expect to see. Nor does it make sense for all the communication to be happening over memory-mapped I/O: this would consume an unnecessary amount of CPU time and isn’t practical for moving the large quantities of data we’d expect from a storage device. Instead, the card is using DMA to directly read and write to and from the Xserve’s memory to transfer data. The incrementing nature of some of the values suggests that they are sequence numbers or otherwise related to some kind of command queueing mechanism, the interrupts are probably signals from the device that it’s finished processing a command, and there are certain values that look awfully like memory addresses, likely used to set up the DMA areas for further communication.
Tracing DMA traffic
It was good to get the first real insights about the communication, but the use of DMA presented a problem: because of the direct nature of DMA, there’s no way to trace it with QEMU’s built-in trace events, so it wasn’t immediately obvious how to collect traces of all communication between host and device. QEMU’s trace events cover accesses the guest OS running in the VM makes to the hardware, but there’s no way to tell when the RAID card writes into the Xserve’s memory, and even if QEMU was set up to trace every single memory access the guest OS made, the performance for that would be unacceptably slow.
After a little research, I settled on an approach: QEMU has an option to store the guest RAM in a file. For minimum performance impact, I put this file in a tmpfs. I slightly modified QEMU’s code to add specific “marker” functions that do nothing, then wrote an external program that used GDB/MI (an API to essentially treat GDB as a library) to set breakpoints on those functions. Every time one of those functions got hit, I’d dump the guest RAM from the file to another file so I could inspect it later and see the results of the DMA transactions and guest memory accesses. With my QEMU modifications, a different “marker” function gets called when macOS writes to device MMIO registers 0x68 or 0x40 (the two registers that seemed like they were telling the device to start processing a new command when macOS wrote to them), as well as when an interrupt is received indicating that the device has finished processing a command and written the results back to the host memory.
 |
|---|
Animation of the memory dumping process. A new dump file is taken at each breakpoint, which in this example were set on writes to register 0x40 and interrupts coming from the RAID Card. |
The choice to write an external program and interface with GDB/MI instead of modifying QEMU more extensively to dump files itself was made in the interest of expediency: I wanted to spend my time doing fun analysis, not muddling my way through the complex and sparsely documented QEMU codebase to do all the dumping in the QEMU process. I also wrote the dumper in Rust, a language that’s easier to program in than C and has more “batteries included”/available for this sort of thing.
Dumping the entirety of the VM’s RAM (I allocated 7 GiB to my VM) was not feasible for performance and disk usage reasons, so I took an educated guess that there would be something interesting in the areas of RAM given by the values that looked like memory addresses being written in the beginning of the MMIO trace (assuming they were being used to set up the DMA). I dumped ~350MB each time one of the breakpoints was hit, yielding a 70GB trace for a series of commands over a few seconds before I stopped it. This approach was immediately fruitful, and I saw some XML SOAP commands like the MacRumors poster had mentioned. By diffing sequential memory dumps, it was easy to make educated guesses about what macOS had changed and what the device must have written via DMA. It quickly became clear that the 0x68 and 0x40 MMIO registers were for two different kinds of commands: 0x68 is for the (mostly) XML commands to the management side of things and 0x40 was probably for the SCSI commands to access the RAID volumes (assuming the MacRumors poster was correct about the volumes being exposed as emulated SCSI devices).
I looked at the XML commands a bit and got a sense of what was going on (device status, the alerts warning about a failed battery, empty list of RAID volumes, etc), but it was clear that the SCSI commands would be the bigger challenge since they were binary, not text-based. At this point, I did a lot of research into the SCSI family of standards so that I had some background and understanding of what I was potentially looking at.
Understanding the SCSI commands
In order to have any shot at understanding the memory dumps I’d captured, I would need some idea of what I was looking for. I decided to start with understanding what SCSI does at a high level, so I could then maybe identify which pieces of the memory dumps corresponded to which high-level SCSI operations. To help with this, I read (parts of) a bunch of SCSI standards (SAM–SCSI Architectural Model, SPC–SCSI Primary Commands, SBC–SCSI Block Commands, and very small bits of a few others) to understand the architectural model and some of the operations/flows involved with some of the layers.
I will spare the details of the SCSI command execution model here and only summarize the relevant pieces. Basically, a command is executed against a particular “logical unit” of a “target” device. The command has a “Command Descriptor Block” (CDB) that contains the opcode and some parameters, a data-out buffer with any data going “out” to the device along with the command (for example, data to be written to disk), and a few other pieces of information that are less important. The response includes three important pieces of information: the status of the command execution, the data-in buffer (any data coming in from the device, for example data being read from disk), and “sense” data, which gives detailed information on the particular reason a command failed, if it did.
My task with this reverse-engineering effort was to identify which parts of the MMIO and DMA traces corresponded to which parts of the SCSI command model. With that information, I could decode and understand the communication between macOS and the device, and I could implement similar communication in my Linux driver. This was easier said than done, however–the SCSI standards leave the exact on-the-wire implementation up to the specific SCSI transport layer protocol and device implementation. For example, SSP–Serial SCSI Protocol–is used for the SAS transport layer, USB Attached SCSI has its own transport layer protocol implemented in terms of USB primitives, and so on. On top of that, the MMIO/DMA interface for the respective SCSI transport protocol controllers is of course dependent on the specific vendor implementation.
Since the exact details of how SCSI commands are represented are so variable, the existing standards and driver implementations for other SCSI adapters were useful only as reference material to understand common ways that SCSI commands are encoded and sent to devices. They helped with understanding what I was looking for, but not with decoding entire commands. I did a fair amount of research on this, looking at how Linux drivers for various SCSI adapters communicated commands to their devices and also looking at the excellent documentation for the virtio family of standards, and in particular virtio-scsi, which has a full-featured yet relatively simple implementation of a SCSI transport over a PCI link.
From my DMA traces, I had a bunch of commands that looked (for example) like this:
01	01	00	3B	00	00	00	00
12	00	00	00	06	00	00	00
00	00	00	00	00	00	00	00
00	17	99	D1	D8	00	00	02
There were some things that changed between commands, like the 2nd 8 bytes and the last 8 bytes, and there were some things that stayed the same.
The first thing that jumped out were the last 8 bytes: in this example we have 00 17 99 D1 D8 00 00 02. 17 99 D1 D8 looked a lot like a memory address within the range I was already dumping. Sure enough, the data at that address changed in the dump captured after the device sent the interrupt following this command, a pretty clear sign that the device had written data to that address in response to this command and an indication that this part of the command structure controlled the address of the data buffer (in this case, the data-in buffer).
The next thing I looked at was the 2nd 8 bytes: several of the commands I captured had this section starting with 12. Sometimes it was followed by other bytes, like 12 01 83. I guessed that this was the SCSI opcode, and indeed 12 is the opcode for the INQUIRY command, used to query basic information about a logical unit. Using information from the SCSI specifications, I was able to decode a bunch of INQUIRY commands and a couple TEST UNIT READY and REPORT LUNS commands (used to query the device for an inventory of its logical units).
Another thing that jumped out was the 3B 00 in the first 8-byte section. This matched the 0x3B00 being written to an MMIO register in the trace right before the write to register 0x40 that triggered my SCSI command dumps:
vfio_region_write 44.380 pid=1224 name=b'0000:01:00.0' index=0x0 addr=0x174 data=0x3b00 size=0x2
vfio_region_write 531572.429 pid=1224 name=b'0000:01:00.0' index=0x0 addr=0x40 data=0x1000000 size=0x4
It seemed likely that this was some sort of command identifier–maybe the SCSI Command Reference Number. I was slowly but surely getting somewhere, identifying the meaning of different parts of the command structure. However, I still didn’t have all the pieces of the puzzle on the memory addressing. There were some commands that looked like this:
01	01	00	3B	00	00	00	00
12	01	83	04	00	00	00	00
00	00	00	00	00	00	00	00
02	32	94	C0	00	00	00	01
and this:
01	01	00	3B	00	00	00	00
12	01	80	0D	00	00	00	00
00	00	00	00	00	00	00	00
08	87	00	00	00	00	00	00
For a long time, I was operating under the assumption that the RAID Card only supported DMA to/from host memory addresses below 32 bits/4 GiB. So far, everything which I had confirmed to be memory addresses had only 4 bytes of nonzero content: the values getting written to the MMIO registers to set up the DMA regions initially and the memory address I had identified in the command above. When I was puzzling over commands like this, I thought the 02 byte might have been some kind of tag for a tagged-union kind of value–indicating that the following bytes should have been interpreted as something other than a memory address. This theory was further bolstered by seeing the 08 87 in some commands (that didn’t change between runs), where clearly 87 00 00 00 was not a plausible memory address, especially not one that would remain the same between boots. I thought the 08 byte could have been some other kind of tag, indicating a third way to interpret the following bytes (tag 00 for a memory address, tag 02 for something else, and tag 08 for yet another thing).
Unfortunately, it was about this point in the project where I hit a brick wall. I had no idea what those two other methods could be, so I didn’t really know what to look for. Just to be sure, I had tried extending my dumper program to detect the 02-prefixed values, treat the 4 following bytes as a memory address, and dump there–dumping memory at 32 94 C0 00 for example, given the command above. I didn’t get any results from this, despite checking and double-checking my endianness, dumper program, etc: that area of memory was definitely not changing. Because I wasn’t making much progress trying to stare at the command bytes and derive more meaning from them (and therefore wasn’t having very much fun), I decided to try a different approach.
Building a “digital twin”
At this point in the project, I had built some understanding of some parts of the host-device communication. Unfortunately, a lot of it was in the form of hand-wavy intuitions: I had a bunch of values that looked like they matched, a bunch of SCSI commands and partial responses that sort of decoded to valid results, a bunch of MMIO sequences that looked like DMA configuration if you squinted the right way, and so on. Also, the knowledge was either in my head or written down in vague sentence fragments in a quickly-growing note–not exactly conducive to rigorously exploring and refining parts of my understanding until I had a better idea of the whole thing.
I decided it might be a good idea to write an emulated copy of the RAID Card to use in QEMU. The idea was to make a “digital twin” of the card with enough fidelity that the existing macOS driver would successfully send it disk I/O commands. The process of building it would force me to formalize my knowledge enough to write it in code, and the digital twin would provide a good launchpad for future experimentation (making it much easier to poke around with what was being transferred over DMA, for example). Concretely, I wanted to poke around in memory to see if I could figure out what the 02 prefix mentioned above was doing and where I might find the DMA-transferred data commanded by that variant.
The initial steps of the emulated copy came together in an iterative, straightforward (if not quick) fashion. I would make some changes to my emulated device code, recompile QEMU, and boot the virtual machine, each time getting the macOS driver to go a bit further in the PCI enumeration/driver binding process before it found a value it didn’t like and errored out. Then I’d compare the output to the trace output from the real card, fix any differences, and see if macOS would go any further. Rinse and repeat a few dozen times, and I had macOS sending XML SOAP commands to my emulated device, just like it did for the first few commands to the real device.
Memory addressing hiccup
I was excited to start poking at the SCSI commands with the 02 prefix in the memory addressing section, but when I finally got to the first command that had this, I was surprised to find that the 02 had been replaced with an 01, a value I hadn’t seen in the traces from the real device. Once again, dumping memory at the address given by the following 4 bytes yielded nothing.
After trying several ideas to make my “digital twin” testing environment as close to the environment with the real card as possible, I found one important difference: I was running my virtual machine with less RAM (4 GiB) than I was when using the real device (7 GiB). I took a few more traces with the real device, starting at 3 GiB and increasing the memory to 7 GiB. The value changed from 01 to 02 as I increased the memory, and changed back as I decreased it. When I tried with 512 MiB, it went back to putting a 00 there, but this was great progress: I already knew what 00 meant and how to dump the memory associated with that kind of command. From these dumps, I got responses that, for the first time, decoded as complete, valid INQUIRY reply data.
Now that I had the reply data, I could search for it in a dump of the entire 7 GiB and find out where it was when the byte I was looking at was 01 or 02. This just barely worked, with the performance of dumping 7 GiB being so atrociously bad that macOS would only send one or two more commands before the first ones timed out and it got into an error state. Nonetheless, I found the same data from the INQUIRY responses elsewhere in memory. Curiously, it was above 4 GiB, which seemed to defeat the assumption from before that the card only supported addresses below 4 GiB. However, it was not at the address I would have expected given what I saw in the command sent to the device. For example, the data from the command that had 02 32 94 C0 00 was at 01 B2 94 C0 00, or roughly 6.79 GiB into the 7 GiB memory file.
To figure out what was going on, I used the info mtree command in the QEMU console to look at the memory map of the VM. This showed that guest RAM was actually split into two discontinuous regions in the address space: 0-2 GiB and 4-9 GiB. This adds up to the total of 7 GiB I had allocated the VM, but with a hole in the middle so that the VM’s physical address space actually spanned 9 GiB. Note that this split/remapping occurs at the level of guest physical addresses (GPA) and is distinct from guest virtual address mapping to GPA. If you think about this, it makes total sense–when we use memory-mapped I/O, we’re using the same address space to talk to devices as we are to read and write to RAM. If we let MMIO regions overlap RAM regions, we wouldn’t be able to access all the physical RAM equipped in the system (this used to be a problem on 32-bit systems equipped with large amounts of RAM for the time–the phenomenon was called the PCI hole).
Unfortunately for me, QEMU doesn’t reflect this hole when using a file to back the VM’s memory. That is, the RAM file is 7 GiB while the complete GPA address space is 9 GiB. As a result, you have to subtract 2 GiB from GPAs higher than 4 GiB to find the offset in the RAM file where that data is actually stored. Using the example above, we have 02 32 94 C0 00 - 80 00 00 00 (2 GiB) = 01 B2 94 C0 00, which matches what we observed above. This solved the mystery of the memory address sections starting with 02 and 01–turns out they were just regular memory addresses, albeit 5-byte instead of 4-byte like I’d assumed–but it didn’t illuminate what was going on with the commands that had 08 87. Subtracting 2 GiB from 08 87 00 00 00 gives an address just past 34 GiB, and my VM’s address space was only 9 GiB, so clearly this was not a memory address. Since macOS didn’t start using that addressing mode until later in the sequence, I decided to come back to this issue later in the project and focus on emulating the next few commands first.
Accelerating development by switching to Python
At this point, I was once again starting to have less fun writing code for the project. As a QEMU device, the emulated RAID card was implemented in C. It was becoming a headache to manage the combination of static data with certain pieces dynamically modified, reading specific sequences of bytes from specific offsets, etc. I was spending too much time on silly pointer mistakes and not enough time making progress. In the interest of maximizing the fun on this project, I decided to take a different approach: the C-implemented QEMU device would just be a “stub” that would convert between the PCI MMIO/DMA accesses and a custom protocol I would develop. It would communicate over a Unix socket with another program implementing that custom protocol and emulating the state and behavior for the SCSI and XML commands. I could then write the other program in another language that was easier to develop quickly in.
I was able to quickly get a basic version of this working using a simple TLV (type-length-value) protocol. I implemented the server side of it in Python, which was much more conducive to rapid iteration on this project than C. My protocol is very simple: A message has a 4-byte header indicating its sequence number (in case I wanted to handle things out-of-order in the future) and number of sections, followed immediately by the sections. Each section has a 4-byte header with 1 byte indicating what kind of section it is (command or response sent via register 0x68 for TSAL, command or response sent via register 0x40 for SCSI commands, or a data buffer for a SCSI command) and 3 bytes for the length of the section, followed immediately by the section payload. Here’s an example message that goes over the Unix socket:
02 00 00 01 | 02 00 00 20 | 01 01 00 3B 00 00 00 00 (...repeat 0x00 for total of 32 bytes in this section)
The first 4 bytes indicate a message with sequence number 2 and 1 section. The second 4 bytes indicate that the section is a SCSI command that’s 32 bytes long, and the 32-byte SCSI command immediately follows (remaining 32 bytes). In this case, it is a TEST UNIT READY command (opcode 0) to LUN 0.
This protocol was easy to read and write from both the C and Python sides. It also meant that, once I was finished implementing all the “primitives” I needed, I could be finished with the C development and do all my work in the Python program, which was less prone to errors and made it easier to hack something together quickly, and was thus more fun to work with.
Using the same iterative approach as before, making the output look just like the real device to make macOS go further and further, I implemented all the commands I had before, except in a much faster, cleaner, and more extensible manner, and then a few more. Unfortunately, I soon ran into commands using the other “mystery” memory addressing model from above: the ones that included 08 87 00 00 00. Thankfully, this was exactly why I had started building the “digital twin”: to make it easier faster to try out new ideas and possibilities and grow my understanding of the communication between host and device.
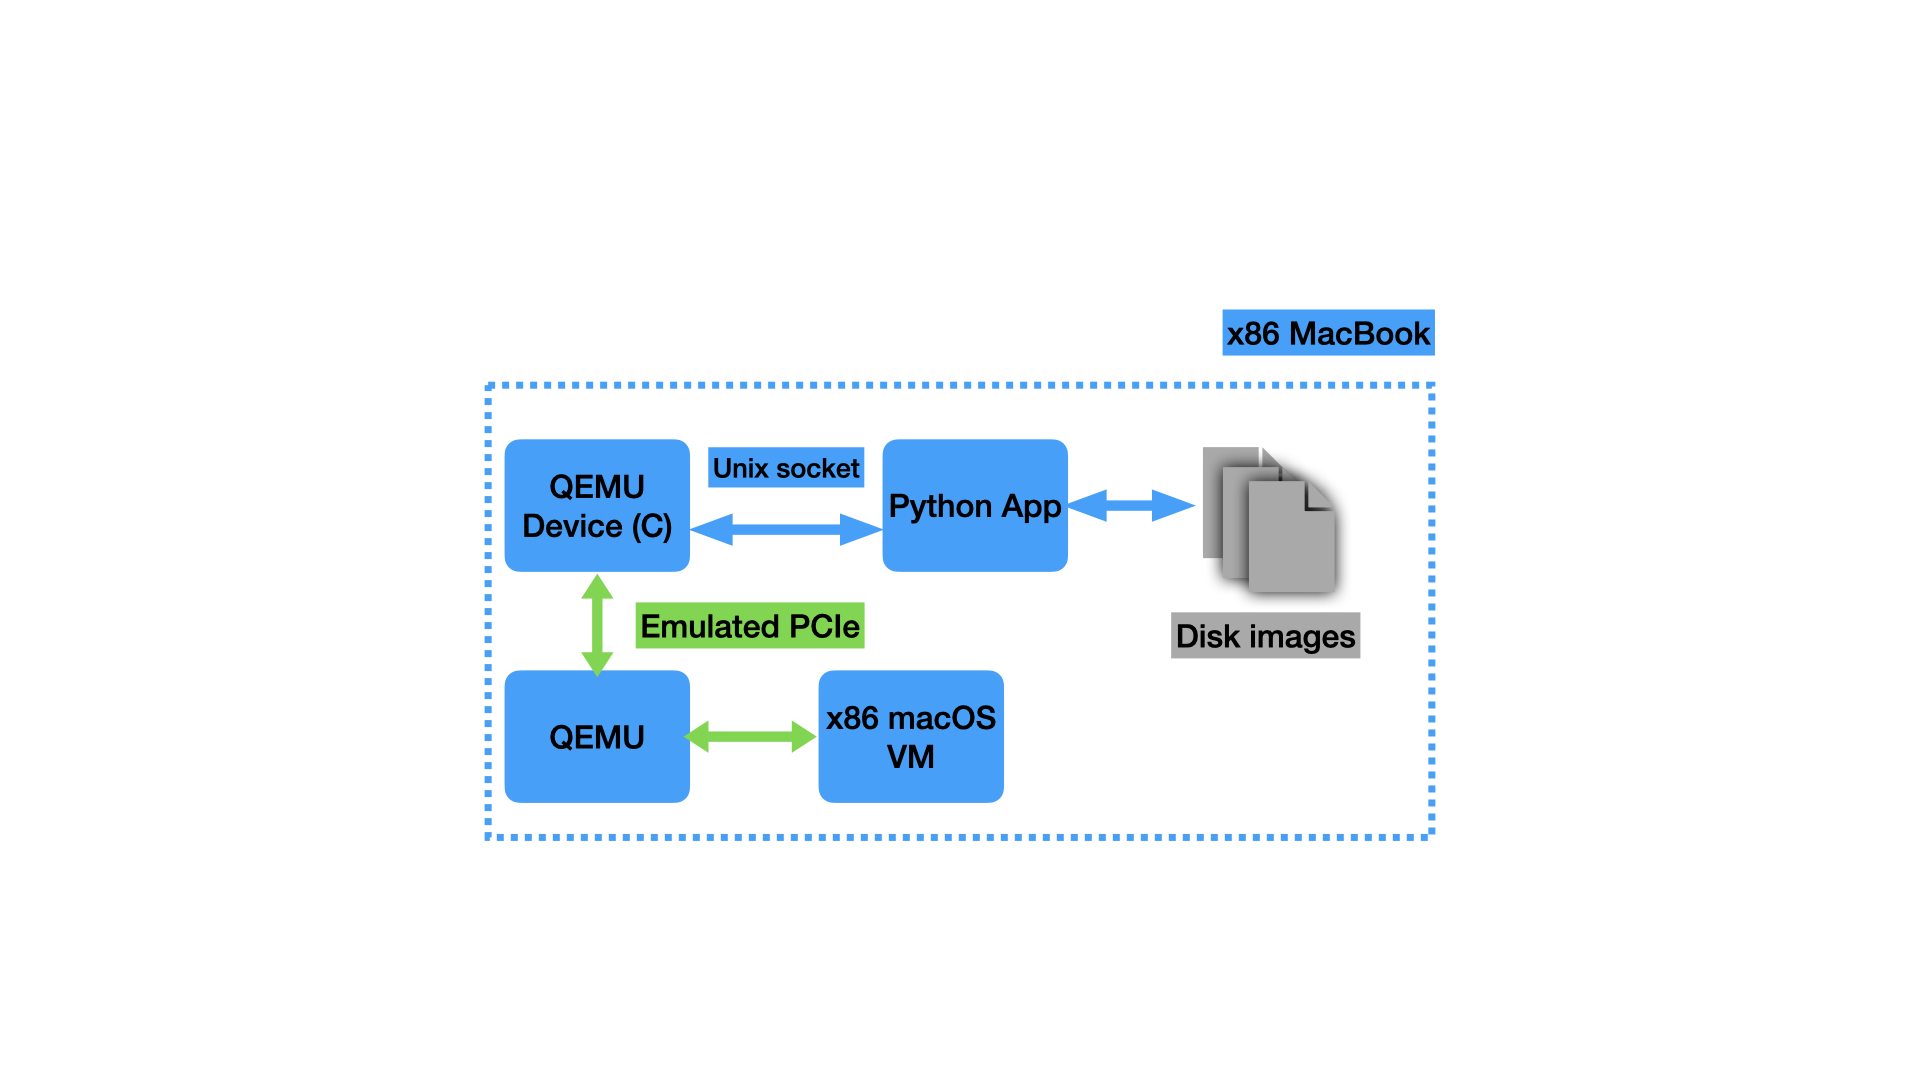 |
|---|
| The final setup for the “digital twin”. macOS runs in a VM on my x86 MacBook Pro, communicating with the “stub” QEMU device in C. This translates the commands to my custom protocol and sends them over the Unix socket to the Python app, which implements all the SCSI commands, backing up the logical units with disk image files. |
Understanding the second mystery memory addressing mode
As discussed above, I had some commands that looked like this:
01	01	00	3B	00	00	00	00
12	01	80	0D	00	00	00	00
00	00	00	00	00	00	00	00
08	87	00	00	00	00	00	00
Clearly, 08 87 00 00 00 was not a memory address like the rest of the commands, because it would be past 34 GiB and my VM’s physical address space was only 9 GiB. One guess I had was that this could be an offset into some other memory buffer somewhere, but what would that be?
Here’s where all the background reading I had done came in handy: one concept I had come across several times was scatter-gather DMA, where the host provides the device with a list, each element in the list comprising an address and the number of bytes to transfer to/from that address. I guessed that maybe 08 87 was an indication that this command’s data-in buffer was described by a scatter-gather list located somewhere else. Sure enough, there was an area of memory captured in my dumps that included content like this whenever commands with 08 87 were issued:
02 31 9B 59 00 00 00 02 | 00 0B 59 D1 D8 00 00 02
This is 16 bytes, and it looks like 2 8-byte instances of the same pattern (I split it with | to make this clear). The beginning of the pattern looks like a memory address, and at the end, there’s a number that I assumed would be the length to transfer. However, it doesn’t quite make sense that we’d be transferring only 2 bytes to each location–the OS typically allocates chunks of physical memory with a much larger granularity than that. I observed that these 8-byte patterns look exactly the same as the memory addressing section (last 8 bytes) of the commands I already knew how to interpret and whose response data I could already locate:
00 17 99 D1 D8 00 00 02
I looked at 0x1799d1d8 for this command and found 8 bytes of data there, suggesting that maybe the 02 at the end indicates the number of 4-byte words to copy. I checked a few other command/response pairs and most others exhibited this pattern as well. It looked like the number at the end of the scatter-gather list entry/memory addressing section was the number of 4-byte words, rounded up to contain any length that wasn’t a multiple of 4 bytes.
There were a few instances where the device seemed to write a few more bytes than the list entry would suggest. Interestingly, while the device did write data there, it seems like it was junk data and not relevant to the response for the command. I became more confident in this assessment by observing that SCSI commands all contain the length of the data-out/data-in buffer, and the junk bytes extending past the end of the length in the command were always in excess of the SCSI data buffer length as well. I assume this is just some quirk of the DMA implementation on the card, where it will sometimes copy junk bytes that aren’t valid or used for anything. Maybe it has some kind of minimum transfer length or alignment or something.
It seemed pretty clear that the number at the end of the list entry was the rounded-up number of 4-byte words to transfer for that entry, so that was one more piece of the puzzle decoded (with the added bonus that I’d made a connection between the scatter-gather list entry format and the memory addressing section format in “regular” commands). With this additional knowledge, it was straightforward to extend my dumper program to support scatter-gather lists. Now I finally had dumps of all the communication, a major milestone in this project. After extending the memory dumper and verifying that I was getting the data I expected from the real device, I also extended my emulated copy to include what I’d learned about the scatter-gather lists.
Decoding SCSI sense data
At this point, I had identified almost every piece of the SCSI protocol puzzle in my DMA traffic dumps. Basically the only important thing I was missing was the sense data, and luckily I was able to use process of elimination to locate and decode it. The initial MMIO setup, early in the traces, told the device about base addresses for six different memory regions. I had successfully identified uses for five of them (SCSI commands, SCSI command queue completion ring buffer, XML commands, XML responses, and DMA scatter-gather lists), so there was only one possibility left.
I assumed that the last unknown memory region I was dumping must contain the SCSI sense data, but most of the values I had observed there were not changing and were just 4 bytes: 02 01 00 3B. To find more interesting dumps, I diffed all my dump files for this memory region with one of the dumps that only had these 4 bytes, so I could identify the ones that had different, more interesting values in them. I found a few that looked like this:
02 05 00 3B 00 12 02 00
70 00 06 00 00 00 00 0A
00 00 00 00 3F 0E 00 00
... more 00 bytes ...
Two important pieces of the SCSI sense data are the “Additional Sense Code” (ASC) and the “Additional Sense Code Qualifier” (ASCQ). The combination of these two values identify a certain condition relating to the failure of the command. Since there are limited nonzero two-byte sequences in what I assumed was the sense data, I just guessed about which two bytes were the ASC and ASCQ. It turns out that the 3F 0E in the example above are the relevant two bytes, in this case indicating a status of REPORTED LUNS DATA HAS CHANGED. The other different dumps had ASC/ASCQ pairs that made sense (POWER ON OCCURRED, INVALID FIELD IN PARAMETER LIST, INVALID FIELD IN CDB), and it was pretty clear that this was the so-called “fixed-format” sense data from the SCSI specification (there are only two options, fixed-format or variable descriptor-based). I was also able to guess and verify that the 02 byte at index 6 was the SCSI status code, in this case indicating a status of CHECK CONDITION, which means that sense data will be present (due to some exceptional status encountered with the processing of the command).
“Digital twin” wrap-up
Now that I had all the major pieces of the SCSI communication figured out, I could proceed with emulating the full set of commands I had observed macOS sending to the real device. Unfortunately, macOS only sends a majority of these commands once you’ve configured a volume in RAID Utility, which communicates with the card over the XML SOAP interface, so I had to emulate that as well. Once again, this was a very iterative process, using mostly static data changed only the minimum amount for macOS to continue sending more commands. This was mostly unremarkable, but I did find that the SOAP interface has yet another way to send SCSI commands to the physical disks as opposed to logical units. This is used to tunnel ATA commands that enable SMART reporting through to the physical disks. Let’s just say that ATA commands wrapped in SCSI commands wrapped in XML are not the prettiest thing in the world.
After implementing all the necessary commands for the XML interface and a few more miscellaneous SCSI commands, it was time to handle the actual disk I/O. I implemented the READ and WRITE commands, storing the data in sparse files so that I could have a 1TB disk image (to minimize the modifications to the static data dumped from the device) without taking up 1TB of space. I booted the macOS VM, ran through the RAID volume creation, and watched as macOS sent write commands that were handled for the first time by my “digital twin”. I mounted the resulting disk images from my host Mac and was able to read files I put on them from the guest macOS, indicating that everything was working properly. This meant my emulation was finally good enough to handle everything I needed it to – it was a good enough facisimile of the real thing for macOS to get all the way through formatting a disk and storing files on it. This also meant that it was good enough for me to start on a Linux driver!
Writing a Linux driver
Driver scaffolding
My high-level plan was to write a Linux driver for the emulated “digital twin”, using a minimal kernel build in a virtual machine for the fastest iteration. Then, once I had the driver working, I would test it on the real hardware. Before this project, I had very limited experience working in the Linux kernel–just one simple project for my operating systems class in college, so I didn’t really know what I was doing beyond the high-level plan. The first order of business was setting up a development environment. I found a guide for setting up a minimal system with a kernel build and BusyBox userspace and adapted it to work on arm64 so I could develop on my Mac. I ran the whole build process from a Linux VM, which made the iteration process rather convoluted: I would edit my files in a VSCode remote window connected to the Linux VM over SSH, build the kernel in the VM, then copy the boot image back out to macOS and use it with QEMU (and the emulated device via the Python unix socket server) to boot a second VM with my custom kernel.
 |
|---|
| My setup for development of the Linux driver. I developed the driver against the “digital twin” attached to an arm64 virtual machine and handled the few x86-specific differences at the last minute. |
After some research into the Linux block and SCSI subsystems, I decided to write the driver as a block device, not as a SCSI device. Although the macOS driver appears to be written as a SCSI device, I wasn’t sure if the RAID Card implemented the entire SCSI command set or just certain commands that macOS was known to send. I also wasn’t sure how certain other pieces of the SCSI specifications were implemented, like Task Management Functions (command cancellation, etc). I decided it would be easier to present a higher level of abstraction to Linux, which would allow me to use only the SCSI stuff I knew for sure the device supported. This is definitely one of the choices I made in the interest of expediency and having fun on this project at the expense of “doing it right”–a SCSI driver is almost certainly the “right” choice for this device, but would have taken me a lot longer to get working.
For me, the hardest part of starting some additions in a new codebase is figuring out how the “scaffolding” is supposed to work–getting your code set up with the project’s build system, the initial functions you need to implement or call, things like that. Throughout the project, I had been watching the excellent Linux driver series by Johannes 4_GNULinux on YouTube, so I had some understanding of what I needed to do, and Johannes has a sample driver for a “PCI echo device” that I used as a starting point for some of this. I adapted the approach a bit, opting to build my driver into the kernel directly, which seemed simpler than making a loadable kernel module.
To write a Linux device driver, you need to implement the correct “interfaces” for your device. In my case, I needed to implement functions to deal with a PCI device and functions to expose a block device. The job of my driver would be to bridge between the block device functions (things like “submit read/write operation”) and the PCI device functions (things like “write this MMIO register” or “set up a DMA transfer”).
Driver functionality
Linux has a number of abstractions that let drivers avoid most of the detail required to deal with the computer’s hardware. For example, it’s just one or two function calls to allocate some memory and set it up to be used with DMA, the end result being a bus address you can give to the device to use for DMA. Device driver programming feels very much like regular C programming with a fully-featured library of common functionality. The driver code can be surprisingly high level, with the only real complexity being that which is inherent to the device the driver is working with. Perhaps the only notable exception that a driver programmer has to be aware of is the context in which their code is running: whether in response an interrupt or in a more normal kernel execution context (worker thread/in response to a system call).
When running in an interrupt context, the kernel must be significantly more careful–interrupts can happen very often, so it’s important that they’re handled performantly. Also, additional interrupts are disabled while an interrupt is being handled (to ensure the handler can run atomically), so spending a long time in an interrupt handler can cause a bunch of other interrupts to pile up. To mitigate these issues, the kernel has certain conventions for code that runs in interrupt context: the work performed should be minimal and the code should not block or sleep. This means that even memory allocation can be difficult (since it might block or sleep on disk I/O if swapping needs to happen), so you need to use special flags to memory allocation functions indicating that sleeping is not allowed (which make the memory allocation more likely to fail). In practice, this means that interrupt handlers do the minimum work required to acknowledge the interrupt to the device, queue up some work to be processed asynchronously when not in interrupt context, and then return control back to whatever code was interrupted. Since this is C and there’s not a great type system or helpful compiler to warn on functions that might block in interrupt context, the programmer must be very careful not to use any such functions.
Roughly speaking, the command processing flow in my driver looks like this:
- Send a command to the device. This looks like finding an unused slot in the DMA region where SCSI commands go, filling it in with the command to send, and then writing the correct MMIO registers to tell the device that part of the DMA region is newly valid to read a command from. It may also include allocating and preparing buffers or scatter-gather lists for DMA (like if we’re going to read or write data from the device).
- When the device has completed the command (including any DMA transfers requested as part of it), it sends an interrupt indicating this.
- The interrupt handler acknowledges the interrupt and reads certain MMIO registers from the device to determine how many commands have completed (if there were multiple) since the last one it acknowledged. It acknowledges (via MMIO writes) the set of commands that have completed up to this point. For each completed command, asynchronous work is enqueued to process the completion, and then the interrupt handler exits.
- At some later time, the asynchronous work to process the command completion runs. This is where the code that enqueued the command is notified of its completion, and any buffers that were set up for DMA are cleaned up.
The kernel has powerful primitives for a lot of this work, including “waitqueues” (used to block submitting a new command until a command slot is available in step 1) and “workqueues” (used to submit work for asynchronous processing outside of the interrupt handler in step 3/4). The rest of the work is just mapping the buffers for DMA and dealing with the MMIO registers that are specific to the device, so it isn’t very difficult to implement.
Block device discovery and handling
In order to be able to read and write the RAID volumes from userspace, we need to expose a block device to the system. To do that, we need certain information about the device: things like the block size and the number of blocks there are (capacity of the device). In my case, I need to query the RAID Card for that information, since it could be exposing any number of volumes of varying sizes (each of which will be exposed as a separate block device). After my driver is finished with the initial setup of the device, it kicks off a series of commands that will discover this information. Specifically, it issues a REPORT LUNS command to get the list of logical units, and then it issues MODE SENSE commands to each logical unit to get their capacity and block size. Once each logical unit’s capacity is known, it is registered as a block device with the system, which triggers the block layer to issue commands reading the partition table of the disk and setting up those partitions for the rest of the system to use.
There are several interfaces you can use to write a Linux block driver. I chose to write a “bio-based” driver, which felt like the easiest way to get going quickly. bio, short for “block I/O” is the name of a struct that represents an I/O operation on a block device. A bio can describe an operation in either the read or the write direction, not both. A bio is made up of one or more bvecs, each of which describes a region of bytes to transfer by memory offset and length. A bio-based driver only needs to implement a “submit bio” function in order to work. In my case, the “submit bio” function just transforms the bio into a SCSI READ or WRITE command for submission to the device. Later, when the SCSI command has completed, there’s a bio_endio function that is called to notify the block layer that the bio has completed. I was able to copy the n64cart block device driver (for Nintendo 64 cartridges), a simple bio-based driver, for a lot of the basic scaffolding and operations.
Driver development and testing on real hardware
Overall, the kernel driver came together relatively quickly. I did encounter a few stumbling blocks along the way–for example, I had significant difficulty getting the block device registered with the kernel and getting the kernel to scan for partitions–but debugging was made a lot easier by the fact that I could easily see what the other side of the code was trying to do, add print statements or temporarily bypass checks, and things like that. Of course, I ran into the typical C memory management mistakes, but they were, for the most part, easy to fix. The kernel has a number of helpful debugging tools, perhaps the most useful in this instance being KASan (Kernel Address Sanitizer), which instruments the kernel with the same kind of runtime checks as ASan does in userspace code and helps the programmer find all sorts of memory management bugs.
I decided I was “finished” writing the driver when I had gotten it to successfully read a SCSI logical unit with an EFI and HFS+ partition from the emulated “digital twin”. At that point, it was finally time to test the driver with the real device. I compiled the kernel for x86 and set up a QEMU VM with the same BusyBox userspace I’d been developing with. This time, I passed through the real RAID Card with VFIO and…it worked the first time! I was able to mount an HFS+ partition I’d created from the macOS VM and read a file from it. I was very pleased that it worked the first time, as it meant I wouldn’t need to spend hours debugging it with the loud roar of the Xserve fans in the background. I think the strategy of building a “digital twin” of reasonable fidelity paid off tremendously, as it not only enabled me to iterate quickly on the driver but also to organize, formalize, and validate all the knowledge I’d gathered about the device and its communication. Of course, as soon as I had it working, my interest in fixing up the rough edges or characterizing/improving the performance was dramatically reduced, but that’s OK. Maybe I’ll get to it sometime as another project.
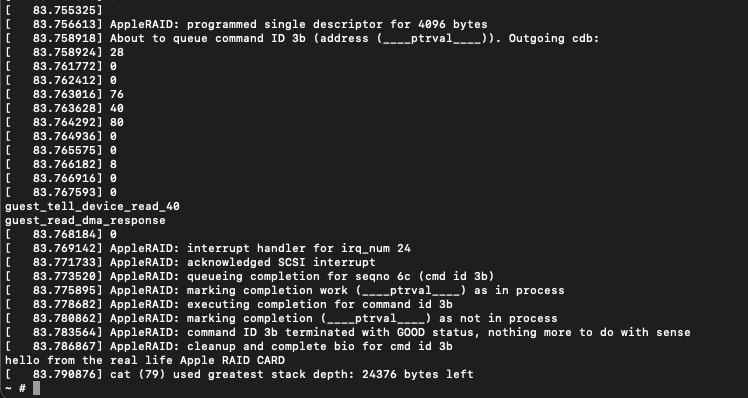 |
|---|
The output from a cat command (mixed with the QEMU console and kernel output) on the Linux VM the first time I tested my driver with the real hardware. I was reading a file I had placed on a RAID volume from macOS. |
Conclusion
This was the largest, most complex personal project I’ve ever done, by far. I learned so many new things, from the basics of setting up a VM with PCIe passthrough, to nitty-gritty details about memory-mapped I/O and DMA, to writing a real device driver running in the Linux kernel. I learned about the PCI(e) and SCSI families of specifications in more detail than I had ever thought I’d need. There were a bunch of side quests I didn’t even mention here, like a detour into the world of (U)EFI firmware drivers. Along the way, my insatiable curiosity about, and incredible fascination with, the way computers work was one of the things that kept me going. One of the major takeaways I got from my college computer science education is that there’s no magic in computing, only layers of abstraction. One of my favorite things about having software skills is that I am empowered to pull apart those layers of abstraction as far as I want to and see how they work inside. Understanding how complex systems work from end to end is incredibly satisfying to me, and the combination of software skills, research skills, and open-source software to poke through means that, given enough time and effort, I can teach myself enough to get a decent understanding of how many complex systems work. Although my “how hard could it possibly be” spirit at the beginning of this project may have been misplaced, I’m glad I started this project based on it. If I had known how much work it would end up being, I probably wouldn’t have done it, but then I wouldn’t have had nearly as much fun or learned nearly as much as I did.
I won’t be attempting to contribute my driver to the upstream Linux kernel. As I mentioned, a SCSI driver is probably a better fit than the block driver I ended up writing, plus my driver is only “hackathon-quality”. I don’t think it would be very fun to spend the time getting it into good shape and then dealing with the kernel contribution process to get it upstreamed. The reality is that this project has very little practical value to others. At some point, I may clean up the code a bit and publish it so that anyone else who’s interested can at least find everything I’ve learned about this device, but otherwise, I see it as just a learning exercise and a fun project.